

What Is Mineral Liberation? Degree of Liberation Explained
What You Will Learn from This Guide
Mineral liberation is the release of a valuable mineral from the gangue it grows with, and the degree of liberation is the share of that mineral found in free particles after comminution. This guide explains free, middling and locked particles, how the degree of liberation is calculated and measured, why grain size sets the grind target, and how liberation data feed into grinding circuit decisions. It is written for process engineers, plant metallurgists and buyers who must decide how fine an ore needs to be ground before you choose between the mining grinding mill types.
Liberation, Middlings and Locked Particles
An ore is a heterogeneous mixture of mineral grains. Galena, chalcopyrite, hematite or gold sits in the rock as grains of a certain size, surrounded by quartz, feldspar, carbonate or other gangue. Crushing and grinding break the rock into particles. Each particle then falls into one of four groups.
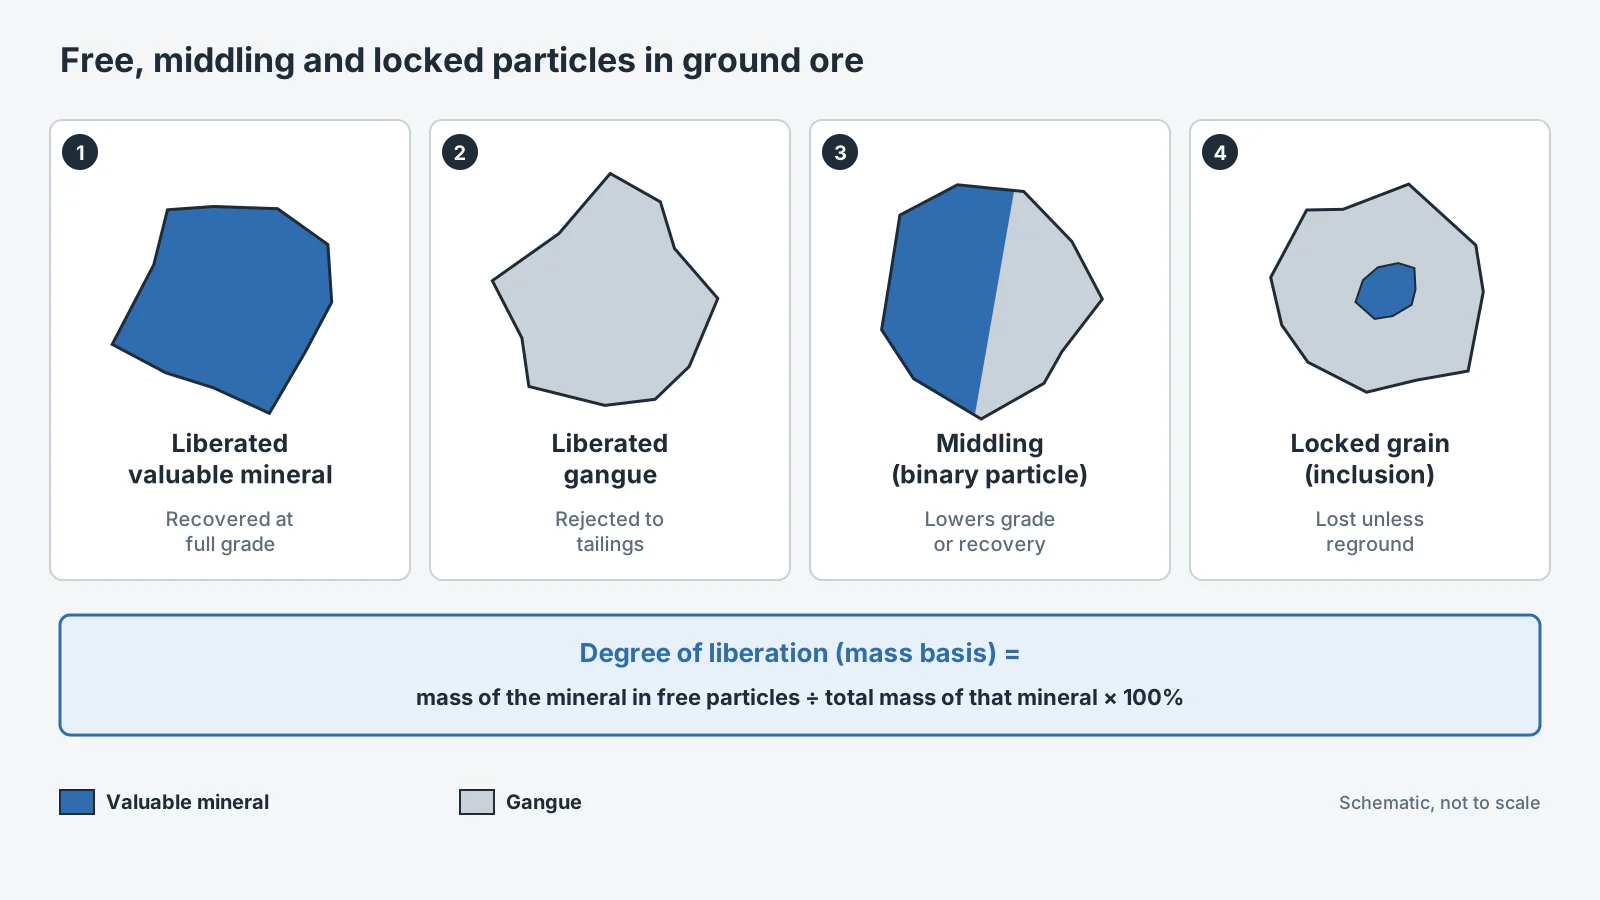
- Liberated (free) valuable mineral: the particle contains only the target mineral. It can report to the concentrate at full grade.
- Liberated gangue: the particle contains no target mineral and can be rejected to tailings.
- Middling (composite or binary particle): the particle contains both phases, with the boundary exposed on the surface. Middlings either dilute the concentrate or are lost to tailings, depending on their composition and the separation method.
- Locked grain (inclusion): a small grain of valuable mineral is fully enclosed in gangue. No surface-based process can see it, so it is lost unless the particle is ground further.
Particles with three or more minerals are called ternary or complex particles. In polymetallic lead-zinc-copper ores they are common, and the same logic applies to each mineral.
Most ores are not liberated by size reduction alone. Breakage is described as random when cracks cut across grains without regard to their boundaries, and non-random when cracks follow grain or phase boundaries. Non-random breakage includes liberation by detachment, where the mineral separates cleanly along its boundary, and preferential breakage, where a softer or more brittle phase breaks faster than the others. An ore with weak grain boundaries liberates at a coarser size and with less energy than its grain size suggests. This is also why the same ore can give different liberation results after crushing and after grinding.
How the Degree of Liberation Is Calculated
The classic definition is a particle count: the number of free particles of a mineral divided by the number of all particles that contain that mineral, free or composite. Modern automated mineralogy usually reports liberation on a mass (or area) basis instead, using the formula shown in the figure above. Both appear in reports, so engineers should check which one a laboratory used before comparing particle size and liberation data from different sources.
The two definitions give different numbers for the same sample. The example below uses illustrative figures for 100 g of a valuable mineral in a ground sample.
| Particle group | Particles containing the mineral | Mass of the mineral (g) |
|---|---|---|
| Free particles | 400 | 62 |
| Middlings | 80 | 28 |
| Locked particles | 20 | 10 |
| Total | 500 | 100 |
| Degree of liberation | 400 ÷ 500 = 80% (count basis) | 62 ÷ 100 = 62% (mass basis) |
Illustrative calculation, not measured data.
The count basis looks better here because free particles of a mineral are often finer than the composites that carry the rest of it. For metallurgical balances, the mass basis is the more useful number, because recovery and grade are mass quantities.
Two further points affect how a liberation figure should be read:
- The “free” threshold is a convention. Some laboratories count a particle as liberated when it holds 95% or more of the mineral by area; others use 90%. Reports often also give the full liberation spectrum: the mass of the mineral in each composition class, for example 0–10%, 10–20% and so on up to 100%.
- Liberation depends on size. A single “degree of liberation” for a whole sample hides the fact that coarse fractions are usually much less liberated than fine ones. Size-by-liberation data, where each sieve fraction is analysed separately, are far more useful for process design.
The size-by-liberation data are the link between mineralogy and flotation and other separation steps.
Why Grain Size Sets the Grind Target
The size of the mineral grains in the rock, together with how the ore breaks, decides how fine the product must be. A common working assumption is that liberation becomes significant only when particles approach the grain size of the valuable mineral, which is why ore texture work comes before ball mill sizing.
The range between ores is wide:
- In QEMSCAN tests on itabirite iron ore from Brazil’s Quadrilátero Ferrífero, quartz was liberated well enough at a P95 of 0.210 mm for a friable itabirite, while a compact itabirite needed a P95 of 0.045 mm. The compact ore, with smaller crystals, lower porosity and more complex texture, needed a grind almost five times finer.
- In a tin-tantalum pegmatite from Spain, columbite-group grains were mostly below 250 µm. Particles in the 1–4 mm fractions were typically composite, and only about half of the tantalite/columbite particles were fully liberated in the finest fractions, below 125 µm.
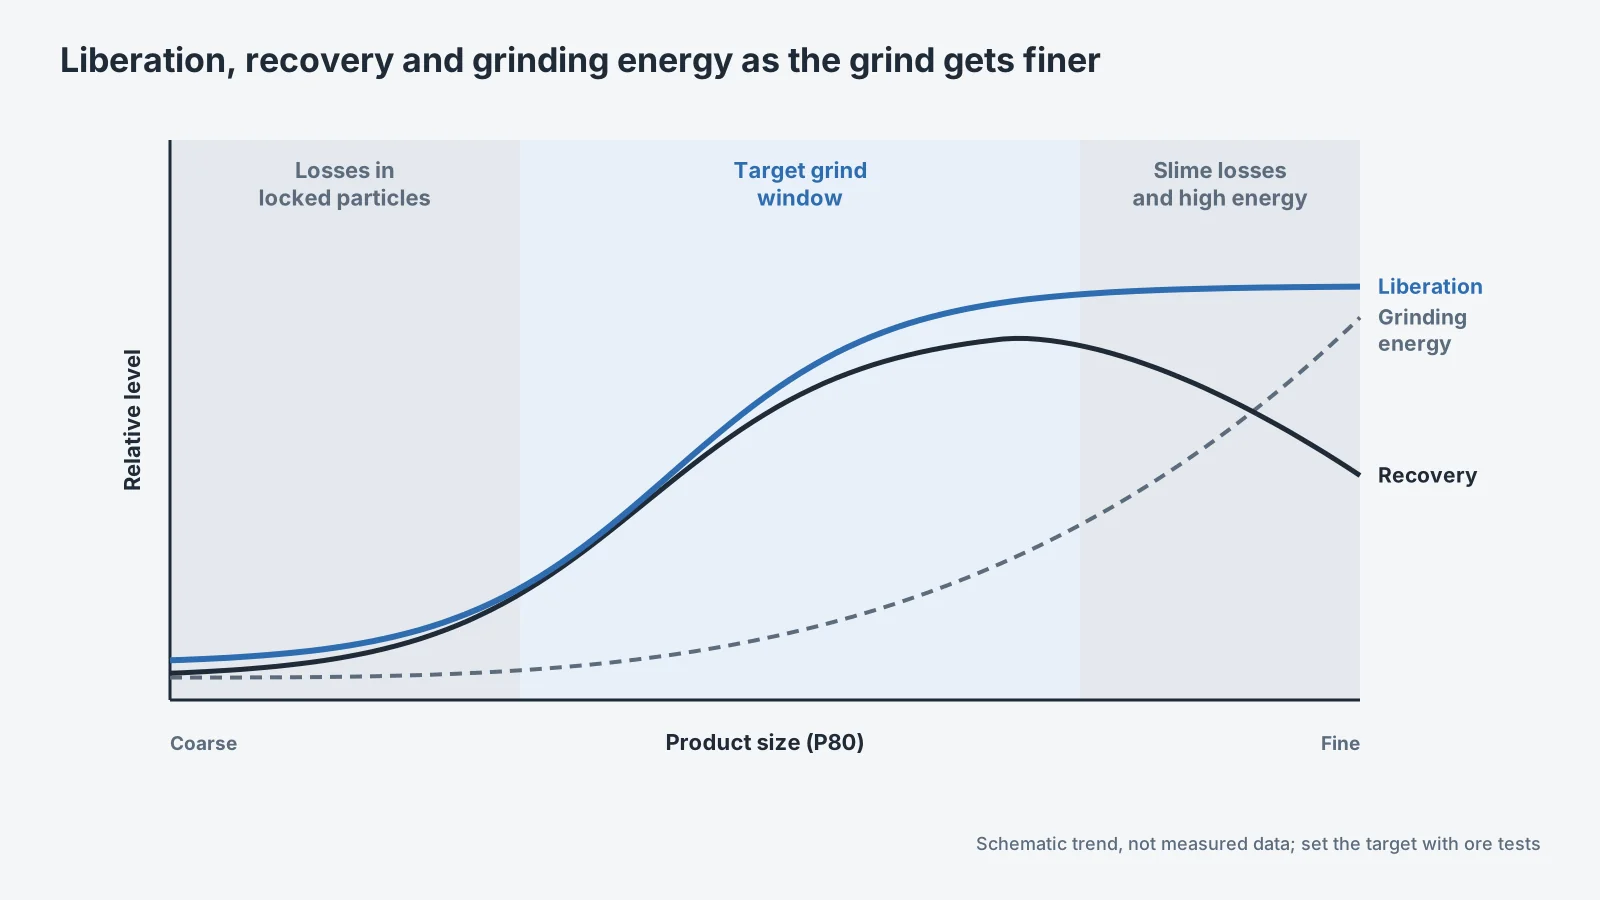
The figure shows the general trade-off. As the grind gets finer, liberation rises and then flattens. Recovery follows liberation at first, then falls when particles become too fine for efficient separation: slimes float slowly, coat coarser particles and consume reagents. Grinding energy rises steeply over the same range. The target grind is the window where extra liberation still pays for the extra energy and the slime losses have not started. This window must be set by tests on the actual ore. The curves in the figure show a trend only.
Overgrinding is the most common way plants lose value on the fine side of this window. Particles that are already liberated stay in the mill and are ground again. Closed-circuit classification and the choice of mill discharge both affect how much this happens. For the discharge side, see grate discharge vs overflow ball mill.
How Liberation Is Measured
Liberation is measured on polished sections of ground and sized samples, usually one section per sieve fraction. The main methods are compared below.
| Method | What it measures | Strengths | Limits |
|---|---|---|---|
| Optical (reflected-light) microscopy | Visual classification of particles in polished sections, often about 500 particles per sample | Low equipment cost; separates mineral varieties such as magnetite and hematite types; allows geological interpretation | Slow; depends on an experienced analyst; fewer particles counted |
| Automated SEM-EDS mineralogy (MLA, QEMSCAN) | Backscattered-electron images plus X-ray analysis, classified into mineral maps | Thousands of particles per section; full liberation spectrum, association and grain size data | 2D section; high cost; may not separate minerals with similar chemistry, such as hematite and magnetite |
| X-ray micro-computed tomography (micro-CT) | 3D images of whole particles | True 3D composition, no sectioning bias | Limited contrast between minerals of similar density; mainly a research and calibration tool |
| Indirect tests (grade-by-size, heavy liquids, lab flotation) | How the mineral distributes by size or density, or how it responds to separation | Simple and close to plant behaviour | Infer liberation; do not measure it directly |
Source: compiled from the references below.
All section-based methods share one bias. A 2D cut through a composite particle can miss the second phase, so the particle looks free. As a result, 2D liberation overstates the true 3D liberation, and plant recovery always sits below the theoretical grade-recovery curve calculated from 2D data. The bias is larger for poorly liberated ores. When optical microscopy and MLA were compared on four Brazilian iron ore samples, the two methods agreed within about 2% on the well-liberated samples, but differed by about 6% on the least liberated one.
A liberation study for a new project normally includes size-by-liberation data for the planned grind and at least one coarser and one finer grind, so the shape of the curve is known. That curve then sets the regrind needs and the cut size of the classifier.
What Each Separation Process Needs from Liberation
Separation processes do not all need the same degree of liberation, because each one acts on a different particle property. For froth flotation, the surface matters; for gravity and magnetic separation, the whole particle matters.
| Process | Particle property used | What liberation it needs |
|---|---|---|
| Froth flotation | Surface chemistry (hydrophobic surface) | Exposed mineral surface. A middling with an exposed grain can float, but more slowly and at lower grade than a free particle |
| Gravity separation | Density of the whole particle | High liberation; a middling has an intermediate density and splits between streams |
| Magnetic separation | Magnetic susceptibility of the whole particle | High liberation for clean concentrates; middlings follow their magnetic mineral content |
| Leaching (for example, cyanidation of gold) | Access of the solution to the mineral | Exposure through a surface or cracks, not full liberation |
In industrial flotation of copper sulphides, both the flotation rate and the maximum recovery of each size class rose with liberation and fell with particle size. Within the ranges studied, liberation had the stronger effect.
Liberation is necessary but not sufficient. In the same Brazilian iron ore tests, three samples had almost the same quartz liberation (90.4–91.2%), yet their flotation recoveries ranged from 43.7% to 89.6%. Mineral varieties, porosity, surface coatings and slimes also control the result, so liberation data should always be read together with separation tests. For gold ores where gravity and leaching are combined, see mercury-free gold processing.
From Liberation Data to Grinding Circuit Design
Liberation data answer the question “how fine?”; the grinding circuit answers “how, and at what cost?”. Several design choices follow directly from the liberation curve.
- Set the primary grind from the curve, not from habit. The P80 should sit where extra fineness still gives a clear gain in recovery. Coarsening the grind to gain throughput reduces liberation; at Olympic Dam, a gradual coarsening of the primary grind to raise throughput lowered sulphide liberation and flotation recovery.
- Use regrinding where only part of the stream needs it. When the valuable mineral is fine-grained, a coarse primary grind followed by regrinding of the rougher concentrate puts the energy into the small mass that needs it. Olympic Dam, for example, is designed for a primary grind of 80% passing 75 µm and a rougher concentrate regrind to P80 30 µm.
- Classify in closed circuit to limit overgrinding. Hydrocyclones or other classifiers remove liberated fine particles from the mill circuit quickly, so they are not ground into slimes.
- Plan for ore variability. Ores from different zones of the same deposit can need very different grinds, as the compact and friable itabirites show. Liberation testing on each ore type gives the range the mill must cover.
The ball mill is the usual machine for the primary and regrind stages of these circuits. The MQ Ball Mill grinds by impact plus sliding and rolling of the media, which are lifted along the liner and then fall. It is offered in dry and wet types, with shells from Ф900×1800 mm (18.5 kW) to Ф3600×4000 mm (800 kW) and a long Ф3000×11000 mm model at 1250 kW. The shell size, motor and ball charge should be selected from the throughput and P80 that the liberation study defines. The steel ball gradation must also suit the target product size. For a flotation feed, the guide to ball mill selection for gold flotation circuits shows how these figures come together in one circuit; full models and data are listed under MQ Ball Mill specifications.
FAQ
What is the difference between liberation and liberation size?
Liberation describes how much of a mineral is in free particles. Liberation size is the particle size at which an acceptable degree of liberation is reached for a given ore, for example a P80 in micrometres. It is the starting point for setting the grind target of the comminution circuit.
Is 100% liberation needed for a good concentrate?
No. Plants rarely grind to full liberation because the energy cost and slime losses rise too fast. Flotation can recover middlings with an exposed grain, and leaching only needs the solution to reach the mineral. The economic target is usually well below full liberation.
Does finer grinding always improve recovery?
No. Below a certain size, recovery falls because fine particles float slowly, coat other particles and use more reagent. Finer grinding also raises energy and media consumption. The best grind is found by testing.
How many particles must be analysed for a reliable result?
For optical point or particle counting, about 500 particles per sample is a common minimum. Automated SEM systems analyse thousands of particles per section, which gives better statistics, especially for low-grade ores.
Can crushing alone liberate a mineral?
Only for coarse-grained ores or ores that break along grain boundaries. Some pegmatites, for example, allow part of the gangue to be rejected after crushing and screening. Most metallic ores need grinding to reach a useful degree of liberation; see mining grinding mill types.
Which ball mill fits a liberation-driven grind target?
For wet flotation feeds, a ball mill in closed circuit with classifiers is the usual choice. Power, liner thickness and ball load for each wet or dry shell size are listed for the MQ Ball Mill.
References & Sources
The articles below cover the definitions, measurements and test results used in this guide. For a plain-language introduction to the size terms, see particle size terms.
- Rodrigues, R. S. & Brandão, P. R. G. (2022). MLA and optical microscopy as complementary techniques to the iron ore geometallurgical studies. REM – International Engineering Journal 75(1)
- Ueda, T., Oki, T. & Koyanaka, S. (2017). Comparison of seven texture analysis indices for their applicability to stereological correction of mineral liberation assessment in binary particle systems. Minerals 7(11), 222
- Guldris Leon, L., Hogmalm, K. J. & Bengtsson, M. (2020). Understanding mineral liberation during crushing using grade-by-size analysis: a case study of the Penouta Sn-Ta mineralization, Spain. Minerals 10(2), 164
- Ferreira, R. F. & Lima, R. M. F. (2014). Mineral liberation evolution after different degrees of comminution on itabirites. ABM Proceedings, 15th Mining Seminar
- The effect of primary grind size on flotation recovery and the theoretical grade-recovery curve at Olympic Dam. Mill Operators Conference 2024, AusIMM
- Vallejos Aravena, P. E. (2016). Caracterización del proceso de flotación industrial a partir de relaciones tamaño-liberación. Universidad Técnica Federico Santa María
Related reading: what is flotation.